* * *
Investors are concerned about the flattening yield curve. Enlarge any image by clicking on it.

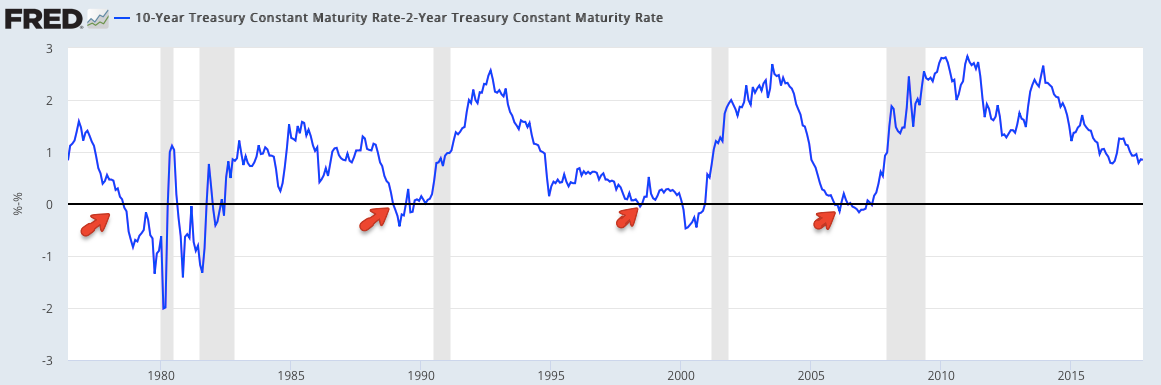
The yield curve measures the gap between long and short term treasuries. The curve "flattens" when either short term rates rise faster than long term rates, or when long term rates fall faster than short term rates. The standard interpretation is that a flattening curve means that the bond market is pessimistic about future growth (low long rates) while the the Federal Reserve is overly worried about inflation (rising short rates). The bond market's view is typically more relevant.
Our monthly macro updates (here) start with the latest yield curve, with the note that the yield curve has 'inverted' a year ahead of every recession in the past 40 years (arrows). With the yield curve still 60 basis points away from inversion, the current expansion will probably last well into 2018, at a minimum. In short, the risk of an imminent recession is low.
As an example, a flattening yield curve (blue line) has been associated with better employment (black line). Again, the main economic risk has been after the yield curve has inverted; note how unemployment has subsequently started to rise (from Topdown Charts).

A flattening yield curve, on its own, has not been a risk to US equities. In the past 40 years, the S&P has typically risen by a median of 6.6% when the curve was flattening from the current level (next two charts from NDR).

The one exception was in 1973: between November 1972 and October 1973, the Fed more than doubled short rates, from 5% to 11%, to combat a spike in inflation, from 3% to 8%. This situation is not analogous to today.
In the past 40 years, it has typically taken 7 months for the yield curve to go from flat to inverted and then another 14 months for a recession to begin. The shortest span from flat to a recession was 10 months, in 1978. During that period, the Fed increased short rates from 6% to 10% and inflation was running at 8%; again, this was not an analogous period to today.

Spiking oil prices have been the primary cause of a flattening/inverting yield curve in the past. Oil (grey area) more than tripled ahead of the curve inverting in both 2000 and 2006-07 (yellow highlights). So far in 2017, oil has risen by just 10% (from John Murphy).

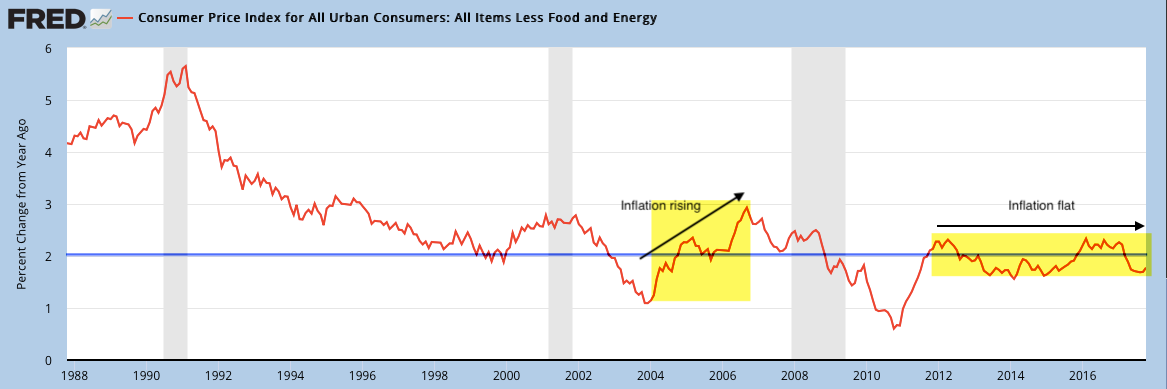
In response to rising oil prices and inflation, the Fed raised rates 17 times between June 2004 and June 2006. In comparison, the Fed has needed to raise rates just 4 times in the past 2 years. Core inflation remains mired at 2%.
Low inflation and low yields outside the US are also contributing to a flatter yield curve (green line) in the US. For example, German 10 year yields (blue line) are just 0.4% versus 2.4% in the US (from John Murphy).

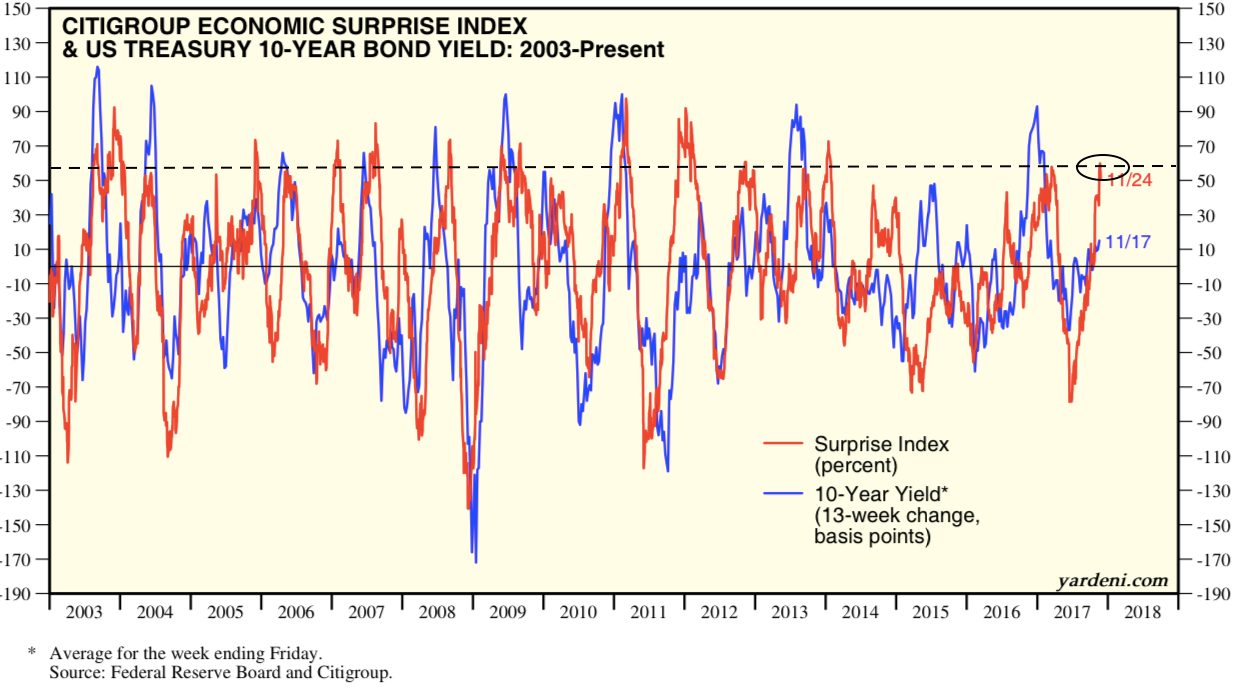
Investors should expect the yield curve to flatten further in the months ahead. The Fed is very likely to enact a 5th rate hike at its December meeting. Meanwhile, macro expectations are ending the year at the highest level since 2013 (red line). Since 10 year yields (blue line) rise and fall with macro expectations, the risk to yields is weighted to the downside (from Yardeni).
On its own, a flattening yield curve is not an imminent threat to US equities. Under similar circumstances over the past 40 years, the S&P has continued to rise and a recession has been a year or more in the future. Investors should expect the yield curve to flatten further in the months ahead.
If you find this post to be valuable, consider visiting a few of our sponsors who have offers that might be relevant to you.