In the past year, the consensus view has been that growth in wages and employment would soon accelerate and that this would lead to a meaningful increase in inflation above the Fed's 2% target. Our monthly review of the data has consistently shown this expectation to be premature.
The irony now is that economic data has seemingly turned negative over the past month. We think this weakness is transitory, mostly driven by the huge drop in energy prices which has lowered inflation and depressed "nominal" price growth. "Real" growth remains positive.
More importantly, the fact that monthly data can swing between extremes underscores the importance of focusing on the trend. And the trend in the majority of the macro data remains positive.
This post updates the story with the data from the past month. Highlights:
- March was the first month in the past 12 where employment gain was less than 200,000. Including March, the average monthly gain in employment during the past year was 260,000, the highest since 1998
- Despite a trend of improving employment, there hasn't been any notable sustained acceleration in wages
- Real personal consumption (70% of GDP) grew 3.0% in February, the second highest rate of growth in 4 years. Core durable goods and industrial production grew 3.1% and 3.5%, respectively
- New home sales were the highest in 7 years
- However, the inflation rate continues to decelerate. It is near its lowest level since 2009
Let's review each of these points in turn. We'll focus on four categories: labor market, inflation, end-demand and housing.
Employment and Wages
The March non-farm payroll (126,000 new employees) was disappointing. It was the first monthly print under 200,000 in a year. It hadn't been above 200,000 that many months in a row since 1993-95.
In the past 12 months, the average gain in employment was 260,000, the highest since 1998.
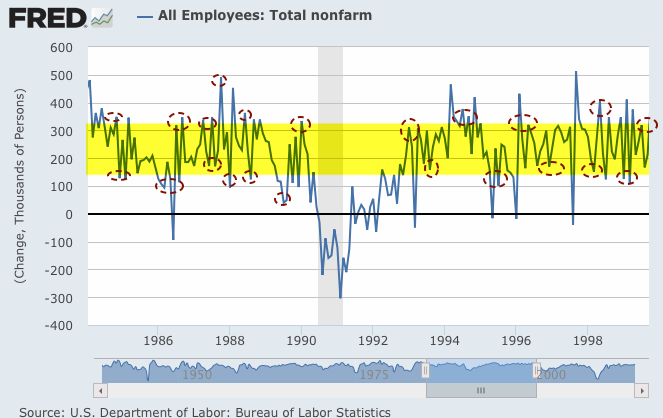
Monthly NFP prints are normally volatile. Since 2004, NFP prints near 300,000 have been followed by ones near or under 200,000. That has been a pattern during every bull market. So while the March print of 126,000 was lower than expected, it fits the historical pattern. A low print was long overdue.

Volatility in NFP is not a recent phenomenon. The 1980s and 1990s bull markets were the same, only the range was higher. If anything, the swings were more extreme: NFP was negative in 1995, 1996 and 1997. So it isn't necessarily a concern that NFP weakened in March. That is, in fact, quite normal.
For this reason, it's better to look at the trend; in March, trend growth was 2.3% yoy, close to the highest since May 2000. Employment growth in the past seven months exceeds even the best single month during the 2003-07 bull market.


The employment cost index shows modest growth in compensation, but the trend is clearly improving. For 4Q14, it was 2.3% yoy, the highest since the recession; this is good news, especially as there is a trend of sequential quarterly improvements.

Inflation
Despite improving employment, inflation has been decelerating in recent months and remains well below 2%.
With oil prices collapsing, CPI dropped to -0.1% in February. The more important core CPI (excluding more volatile food and energy) grew 1.7%, a small increase from last month. Consensus expectations are that inflation will accelerate but it hasn't happened.

The Fed prefers to use personal consumption expenditures (PCE) to measure inflation; total and core PCE were 0.3% and 1.4% yoy, respectively, in February . Neither has been above 2% since 2Q 2012. Like CPI, there has been no sustained acceleration in inflation, and the rate is well below levels in 2003-07.

For some reason, many mistrust CPI and PCE. MIT publishes an independent price index (called the billion prices index). It tracks both CPI and PCE closely.

Demand
Next, let's look at several measures of demand growth. Regardless of which data is used, real demand has been growing at about 2-3%, equal to about ~3-4% nominal.
On an annual basis, real (inflation adjusted) GDP growth through 4Q14 was 2.4%. 4Q growth was slightly above the middle of the post-recession range (1.5-3.0%). It's positive, but lower than what the US is used to; prior expansionary periods since 1980 experienced growth of 2.5-5% yoy. There's no obvious acceleration taking place.

Stripping out the changes in GDP due to inventory produces "real final sales". This is a better measure of consumption growth than total GDP. In 4Q14, this grew 2.4% yoy, down from 2.8% in 3Q14 which was the highest in 8 years (since 4Q 2006). A sustained break above 2.5% would be noteworthy. Not yet.

Similarly, the "real personal consumption expenditures" component of GDP (defined), the component which accounts for about 70% of GDP, grew at 2.9% yoy in 4Q14, at the high end of its post-recession range (2-3%). This is approaching, but still below, the 3-5% that was common in prior expansionary periods after 1980.

On a monthly basis, the growth in real personal consumption expenditures was 3.0% yoy in February, the second best rate of growth in 4 years; it was 3.4% yoy in January, the highest rate of growth since October 2006, more than 8 years ago.

Real retail sales grew 1.8% yoy in the past month. The latest print was the third lowest in the past 3 years; it follows a 3.8% yoy gain in January, the third highest in 3 years. The range has been 1.5-4% yoy for most of the past 20 years.

Not surprisingly, the culprit in the decline in retail sales was the price of gasoline: retail sales excluding gas stations grew 4.3% (nominal) in February.

Core durable goods orders (excluding military, so that it measures consumption, and transportation, which is highly volatile) grew at 3.1% yoy (nominal) in February. During the heart of the prior bull market, growth was typically 7-13%. You can see that weak growth in winter has been a pattern the past three years (arrows).

This is also a nominal measure and thus negatively impacted by the fall in the inflation rate. On a real basis, growth in past month remained strong (blue line is real; red line is nominal; chart from Doug Short).

In February, industrial production growth was 3.5%. The manufacturing component (excluding mining and oil/gas extraction) grew 3.7%. The typical range for annual growth in Industrial Production has been 1.5-5% through the past 15 years: the current reading is therefore in the middle of the range. During much of the 1990s, the range was higher: 3.5-7%.

Housing
Finally, let's look at two measures of housing. Housing starts data was disappointing in February but housing sales and permits were at 7 year highs. It's likely the drop in starts was related to the harsh winter and should rebound in spring. Overall levels of construction and sales are small relative to prior bull markets.
First, new houses sold was 539,000 in February, the highest since early-2008, 7 years ago. The overall level of sales is still meager relative to prior bull markets. 30 years ago, 600,000 would have been at the low end of the range for monthly sales.

Second, overall starts in February fell to the same levels as in January 2013 and 2014, probably due the harsh winter in the East and Mid-West. The overall level of construction is well off those during the prior two bull markets, but the trend is positive.


Single family housing starts in February fell to the same level as in January and June 2014 (blue line), as did multi-unit housing starts (red line).

Summary
In summary, the major macro data so far suggest positive, but modest, growth. This is consistent with corporate sales growth. SPX sales growth the past year has been positive but only 3.3% (nominal).
The consensus expects sales growth of about 2-4% per annum (nominal) thru 2016, excluding the volatile energy sector; the macro data presented here makes this seem reasonable.

With valuations at high levels, the current pace of sales growth is likely to be the limiting factor for equity appreciation. This is important, as the consensus expects earnings to grow at 3% in 2015 and 12% in 2016.
Modest growth should not be a surprise. This is the classic pattern in the years following a financial crisis like the one experienced in 2008-09. It is also what the flattening spread in yields signaled for all of 2014. There are signs that this may now be reversing in 2015.


If you find this post to be valuable, consider visiting a few of our sponsors who have offers that might be relevant to you.